
Real-Time Data


Click for Doug's Current Rooftop Detailed Weather Reports
Current Monthly NOAA Type Report
Current Detailed Monthly Report
Current Detailed Yearly Report
Weather Undergound with Historical Graphs, Webcam Images, etc.

![]()
Citizens Weather Observer Program Data for My Rooftop Location
Current Radar Images


![]()
Ski Sundown National Ski Patrol
National Library of Medicine Search Page
Connecticut State Medical Society
NASIOC.com - North American Subaru Impreza Owners
Club
Real
Time Satellite Tracking, Iridium Flares, etc.
International
Space Station
National Weather Service Forecast Office - Albany, New York
Hartford, Connecticut Radar Loop by Intellicast
Weather for You - forecasts, conditions, history
Doug's Weather Station History
The weather data gathered up until July, 2000, was from a Peet Brothers Ultimeter II weather station including rooftop anemometer, wind direction vane, shielded temperature probe, and rain gauge with 0.1" sensitivity. This was fed into the desktop unit, and then into the serial port of an old Emerson 286 16 MHz where Peet Datalogger software recorded the real time weather every five minutes. The daily highs, lows, and rain totals were then transferred to Excel where they were averaged by month and graphed. Because of Y2K problems with the Peet Datalogger software, no data was obtained from January, 2000 until July, 2000. A new system was put into place consisting of a Peet Ultimeter 2000, a Peet Weather Buffer continuous recording device, and the same rooftop equipment as before. The new software was the WinUlt 2.0 datalogger program. Output of logged tabular data was then fed into Excel as before and the resulting graphs are shown below.
Effective
the end of June, 2004, the master weather station unit was upgraded to a Peet
Ultimeter 2100 offering greater memory capacity,
processing speed, and updated wind chill calculations. In January, 2005,
the rain gauge was upgraded to a tipping bucket design with resolution of
0.01 and the weather software was changed to Weather
Display which enables the dedicated weather web page and data collection.
For many years, until March, 2019, this software ran on a dedicated Dell laptop running WinXP,
24/7.
In August, 2011, the anemometer setup and weather console was upgraded to the newest version of the Peet Ultimeter 2100. The anemometer is the now the Pro version, with significantly larger wind cups and wind vane affording much greater sensitivity in low winds under 5mph and better resolution with the ability to read fractions of mph. This sensor worked well until November, 2023. It was replaced with the same component the same month. In May, 2019, the outdoor temperature and humidity sensor was upgraded to a shielded model and re-located to be further away from the main house and over a more grassy surface, yielding more accurate readings.
The weather data is also being uploaded to the Citizen Weather Observer Program and Weather Underground. The Citizen Weather Observer Program is a national network of weather stations whose data is regularly checked for accuracy and made available to the NWS, NASA, National Center for Environmental Prediction, and other agencies. Weather Underground is a useful site that displays many personal weather stations around the world and also manages the webcam image.
After many years, I moved this page over to its own domain in November, 2016. This allows for greater storage of files and therefore better availability of historical data.
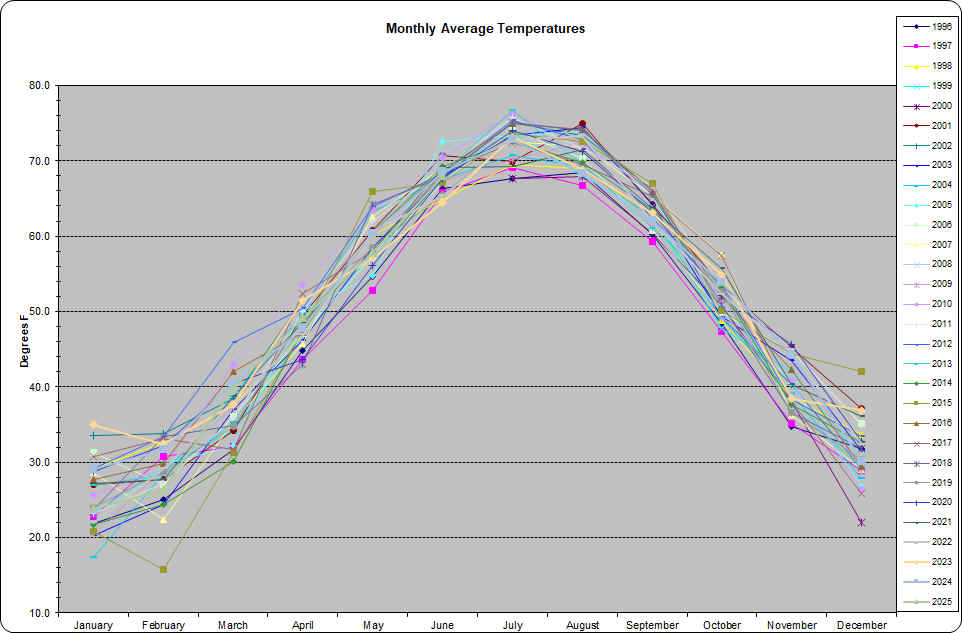
Here's the data by month and year:
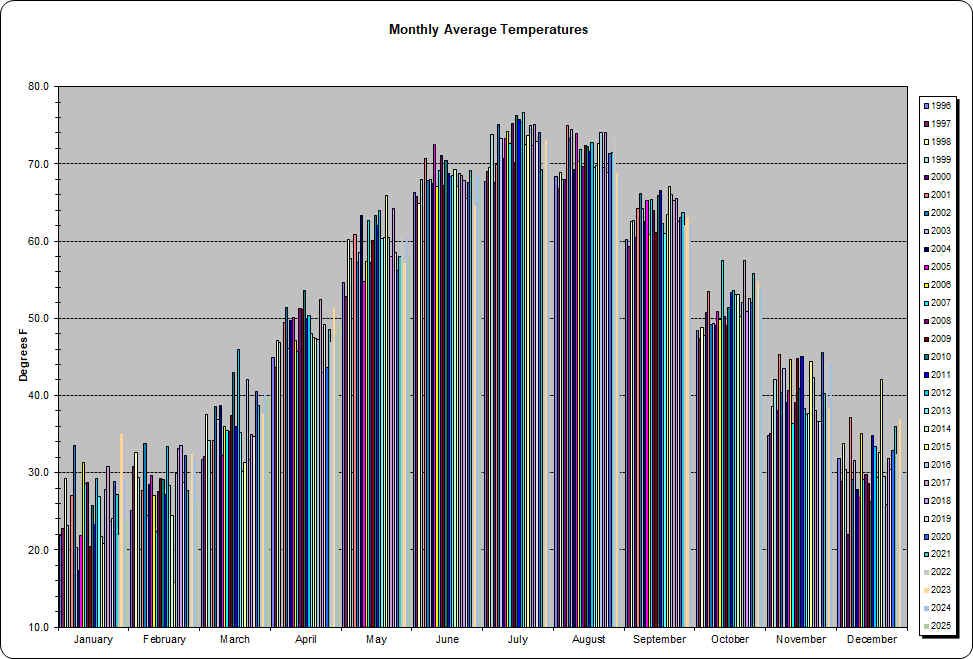
Here's the raw data:
|
Month |
1996 |
1997 |
1998 |
1999 |
2000 |
2001 |
2002 |
2003 |
2004 |
2005 |
2006 |
2007 |
2008 |
2009 |
2010 |
2011 |
2012 |
2013 |
2014 |
2015 |
2016 |
2017 |
2018 |
2019 |
2020 | 2021 | 2022 | 2023 | 2024 | 2025 |
Average |
Month |
|
January |
21.9 |
22.8 |
29.2 |
23.2 |
N/A |
27.1 |
33.5 |
20.3 |
17.3 |
21.9 |
31.3 |
28.6 |
28.8 |
20.4 |
25.7 |
23.3 |
29.2 |
26.9 |
21.7 |
20.8 |
27.8 |
30.8 | 23.7 | 24.0 | 28.8 | 27.2 |
22.0 |
35.0 | 29.1 |
23.8 |
25.7 |
January |
|
February |
25.1 |
30.8 |
32.6 |
29.4 |
N/A |
27.7 |
33.8 |
24.4 |
28.5 |
29.6 |
27.0 |
22.4 |
27.6 |
29.2 |
29.1 |
27.2 |
33.4 |
28.4 |
24.4 |
15.8 |
29.9 | 33.1 | 33.5 | 28.8 | 32.3 | 27.6 | 29.1 | 32.5 | 31.7 | 26.3 |
28.7 |
February |
|
March |
31.7 |
32.0 |
37.5 |
34.2 |
N/A |
34.2 |
38.5 |
36.9 |
38.7 |
32.2 |
36.0 |
35.4 |
35.4 |
37.5 |
42.9 |
36.0 |
45.9 |
|
30.1 |
31.3 |
42.1 | 31.7 | 34.9 | 34.7 | 40.5 | 38.7 | 37.8 | 37.6 | 40.5 | 39.8 |
36.6 |
March |
|
April |
44.9 |
43.7 |
47.1 |
46.8 |
N/A |
49.5 |
51.4 |
46.1 |
49.8 |
50.1 |
47.1 |
45.7 |
51.3 |
51.1 |
53.6 |
50.0 |
50.4 |
|
47.5 |
47.4 |
47.2 | 52.4 | 42.9 | 49.2 | 43.7 | 48.5 | 46.9 | 51.5 | 47.7 | 49.2 |
48.3 |
April |
|
May |
54.6 |
52.8 |
60.2 |
57.7 |
N/A |
60.8 |
57.2 |
58.5 |
63.3 |
54.7 |
57.3 |
62.6 |
57.2 |
60.1 |
63.4 |
62.0 |
64.0 |
|
60.5 |
65.9 |
60.4 | 57.9 | 64.3 | 58.5 | 56.1 | 57.9 | 60.7 | 57.1 | 60.4 | 57.9 |
59.5 |
May |
|
June |
66.3 |
65.8 |
64.8 |
68.0 |
N/A |
70.7 |
67.8 |
68.0 |
67.5 |
72.5 |
67.1 |
69.2 |
71.1 |
67.2 |
70.5 |
68.8 |
68.4 |
68.5 |
60.3 |
67.1 |
68.7 | 68.4 | 67.9 | 65.6 | 67.6 | 69.2 | 65.3 | 64.5 | 68.5 | 68.0 |
68.0 |
June |
|
July |
67.7 |
69.1 |
69.5 |
73.8 |
67.6 |
69.9 |
75.1 |
73.3 |
70.7 |
73.3 |
74.1 |
72.6 |
75.2 |
70.1 |
76.3 |
75.7 |
75.3 |
|
72.5 |
73.7 |
75.0 | 72.4 | 75.0 | 72.9 | 74.0 | 69.3 | 72.7 | 73.1 | 72.8 |
72.7 |
July |
|
|
August |
68.4 |
66.8 |
68.9 |
68.0 |
67.9 |
75.0 |
73.3 |
74.4 |
69.2 |
73.9 |
70.3 |
71.8 |
69.7 |
72.4 |
72.2 |
71.6 |
72.8 |
|
69.8 |
72.6 |
74.1 | 69.5 | 74.0 | 68.9 | 71.3 | 71.5 | 73.3 | 68.8 |
68.3 |
71.0 |
August |
|
|
September |
60.2 |
59.3 |
62.5 |
62.7 |
60.4 |
64.2 |
66.2 |
64.2 |
62.6 |
65.3 |
60.8 |
65.3 |
63.9 |
61.1 |
65.9 |
66.6 |
62.3 |
|
63.5 |
67.0 |
66.0 | 65.3 | 65.5 | 62.5 | 63.1 | 63.7 | 62.0 | 63.1 |
62.1 |
63.4 |
September |
|
|
October |
48.4 |
47.4 |
48.8 |
47.7 |
50.8 |
53.5 |
49.2 |
49.4 |
49.0 |
50.9 |
49.8 |
57.6 |
50.2 |
49.0 |
51.4 |
53.3 |
53.5 |
|
53.1 |
50.2 |
52.0 | 57.5 | 50.9 | 52.6 | 52.1 | 55.7 | 52.3 | 54.9 |
53.8 |
51.7 |
October |
|
|
November |
34.8 |
35.1 |
38.5 |
42.0 |
38.0 |
45.3 |
40.3 |
43.5 |
39.1 |
40.6 |
44.7 |
36.3 |
39.1 |
44.8 |
40.9 |
45.1 |
38.3 |
|
37.6 |
44.4 |
42.4 | 38.0 | 36.6 | 36.6 | 45.6 | 40.3 | 44.4 | 38.4 |
44.2 |
40.4 |
November |
|
|
December |
31.8 |
28.8 |
33.7 |
30.4 |
21.9 |
37.1 |
29.1 |
31.6 |
27.8 |
26.8 |
35.1 |
29.1 |
29.7 |
28.6 |
26.3 |
34.9 |
33.4 |
29.4 |
32.6 |
42.1 |
29.5 | 25.8 | 31.8 | 30.4 | 32.8 | 36.0 | 32.4 | 36.9 |
30.1 |
31.2 |
December |
|
|
Yearly Average |
46.3 |
46.2 |
49.5 |
48.7 |
N/A |
51.3 |
51.3 |
49.2 |
48.6 |
49.3 |
50.1 |
49.7 |
49.9 |
49.3 |
51.5 |
51.2 |
52.2 |
49.5 |
48.6 |
49.9 |
51.3 |
50.2 | 50.1 | 48.7 | 50.6 | 50.2 |
49.9 |
51.1 | 50.8 |
44.2 |
49.8 |
Yearly Average |
And rainfall amounts as well:
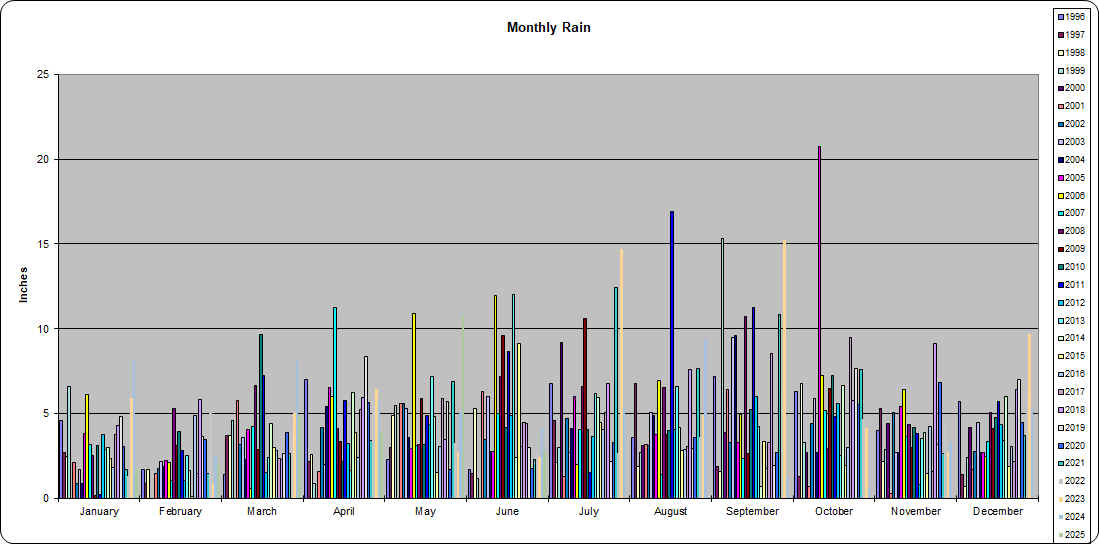
Please note: Only liquid precipitation is recorded. Occasionally snowmelt will record as well. The rain data are only accurate for days that were above freezing.
Here's
the raw data:
|
Month |
1996 |
1997 |
1998 |
1999 |
2000 |
2001 |
2002 |
2003 |
2004 |
2005 |
2006 |
2007 |
2008 |
2009 |
2010 |
2011 |
2012 |
2013 |
2014 |
2015 |
2016 | 2017 | 2018 | 2019 | 2020 | 2021 | 2022 | 2023 | 2024 | 2025 |
Average |
Month |
|
January |
4.6 |
2.7 |
2.5 |
6.6 |
N/A |
2.1 |
0.9 |
1.7 |
0.9 |
3.82 |
6.14 |
3.21 |
2.54 |
0.19 |
3.11 |
0.22 |
3.77 |
2.89 |
2.98 |
2.35 |
1.86 | 3.75 | 4.31 | 4.83 | 3.09 | 1.70 | 1.35 | 5.91 | 8.24 |
1.77 |
3.10 |
January |
|
February |
1.7 |
0.9 |
1.7 |
3.6 |
N/A |
1.5 |
1.8 |
2.2 |
1.9 |
2.22 |
2.14 |
1.04 |
5.33 |
3.10 |
3.94 |
2.85 |
1.07 |
2.54 |
1.63 |
0.13 |
4.87 | 1.50 | 5.82 | 3.67 | 3.46 | 1.45 | 5.12 | 0.9 | 2.55 | 2.14 |
2.47 |
February |
|
March |
1.4 |
3.7 |
3.7 |
4.6 |
N/A |
5.8 |
3.2 |
3.6 |
2.3 |
4.08 |
0.59 |
4.26 |
6.64 |
2.87 |
9.68 |
7.28 |
1.55 |
|
4.44 |
2.98 |
2.83 | 2.34 | 2.29 | 2.67 | 3.89 | 2.63 | 4.04 | 5.05 | 8.12 | 4.83 |
3.92 |
March |
|
April |
7 |
2.2 |
2.6 |
0.9 |
N/A |
1.6 |
4.2 |
2.0 |
5.4 |
6.54 |
6.04 |
11.25 |
4.14 |
3.39 |
2.17 |
5.79 |
3.27 |
1.64 |
6.27 |
3.88 |
2.44 | 5.22 | 5.95 | 8.38 | 5.68 | 3.44 | 5.88 | 6.44 | 5.76 | 3.95 |
4.60 |
April |
|
May |
2.3 |
3 |
4.9 |
5.5 |
N/A |
5.6 |
5.6 |
5.3 |
3.6 |
2.94 |
10.89 |
3.14 |
3.20 |
5.89 |
3.18 |
4.92 |
4.36 |
|
4.83 |
1.51 |
3.06 | 5.91 | 3.48 | 5.74 | 1.73 | 6.92 | 3.25 | 2.73 | 5.15 | 10.77 |
4.71 |
May |
|
June |
1.7 |
1.5 |
5.3 |
1.2 |
N/A |
6.3 |
3.5 |
6.0 |
2.8 |
2.80 |
11.98 |
5.02 |
7.20 |
9.62 |
4.16 |
8.69 |
4.88 |
12.03 | 2.42 |
9.13 |
3.07 | 4.46 | 4.41 | 2.99 | 1.77 | 2.33 | 2.88 | 2.42 | 4.2 | 2.73 |
4.58 |
June |
|
July |
6.8 |
4.6 |
2.1 |
3 |
9.2 |
1.3 |
4.7 |
2.7 |
4.1 |
6.01 |
1.99 |
4.06 |
6.60 |
10.61 |
4.07 |
1.55 |
3.68 |
6.19 | 5.96 |
4.49 |
4.07 | 5.08 | 6.77 | 2.20 | 3.33 | 12.44 | 2.69 | 14.7 | 5.42 |
5.01 |
July |
|
|
August |
3.6 |
6.8 |
1.9 |
2.7 |
3.1 |
3.2 |
3.1 |
5.1 |
4.9 |
3.80 |
6.94 |
1.43 |
6.54 |
3.76 |
3.99 |
16.89 |
4.08 |
6.58 | 4.17 |
2.86 |
2.89 | 3.05 | 7.62 | 2.93 | 3.61 | 7.65 | 3.61 | 4.92 | 9.32 |
4.70 |
August |
|
|
September |
7.2 |
1.9 |
1.6 |
15.3 |
3.9 |
6.4 |
3.3 |
9.5 |
9.6 |
3.31 |
4.97 |
2.34 |
10.74 |
2.63 |
5.26 |
11.27 |
6.02 |
4.23 | 0.70 |
3.38 |
1.76 | 3.33 | 8.55 | 1.94 | 2.69 | 10.85 | 6.51 | 15.25 | 1.35 |
5.53 |
September |
|
|
October |
6.3 |
1.3 |
6.8 |
3.3 |
2.7 |
0.7 |
4.4 |
5.9 |
2.7 |
20.75 |
7.24 |
5.2 |
2.95 |
6.46 |
7.26 |
4.84 |
5.63 |
2.51 | 6.66 |
1.96 |
3.02 | 9.48 | 5.75 | 7.66 | 5.57 | 7.6 | 4.68 | 4.13 | 0.55 |
5.13 |
October |
|
|
November |
4 |
5.3 |
2.2 |
2.9 |
4.4 |
0.3 |
5.1 |
2.7 |
2.7 |
5.41 |
6.45 |
3.64 |
4.38 |
3.03 |
4.18 |
3.85 |
0.81 |
3.56 | 3.91 |
1.48 |
4.26 | 1.58 | 9.13 | 3.19 | 6.86 | 2.63 | 4.37 | 2.73 | 3.33 |
3.61 |
November |
|
|
December |
5.7 |
1.4 |
0.7 |
2.4 |
4.2 |
1.7 |
2.8 |
4.5 |
2.7 |
2.74 |
2.49 |
3.35 |
5.05 |
4.12 |
4.80 |
5.69 |
4.36 |
|
6.02 |
1.9 |
3.09 | 2.21 | 6.43 | 7.03 | 4.46 | 3.73 | 6.15 | 9.72 | 5.36 |
3.94 |
December |
|
|
Yearly Total |
52.3 |
35.3 |
36 |
52 |
N/A |
36.5 |
42.6 |
51.2 |
43.6 |
64.42 |
67.86 |
47.94 |
65.31 |
55.67 |
55.8 |
73.84 |
43.48 |
55.24 |
49.99 |
36.05 |
37.22 | 47.91 | 70.51 | 53.23 | 46.14 | 63.37 | 50.63 | 74.9 | 59.35 | 26.19 |
51.32 |
Yearly Total |
Last Updated July 1, 2025
You are visitor
We're Always
working on it... Send
comments/questions to newhartfordweather at gmail dot com 